10 Year LCI Update, Avondale
2013
Founded in 1924 by George F. Willis, the City of Avondale Estates is the earliest known planned community in the southeast. Willis transformed the...
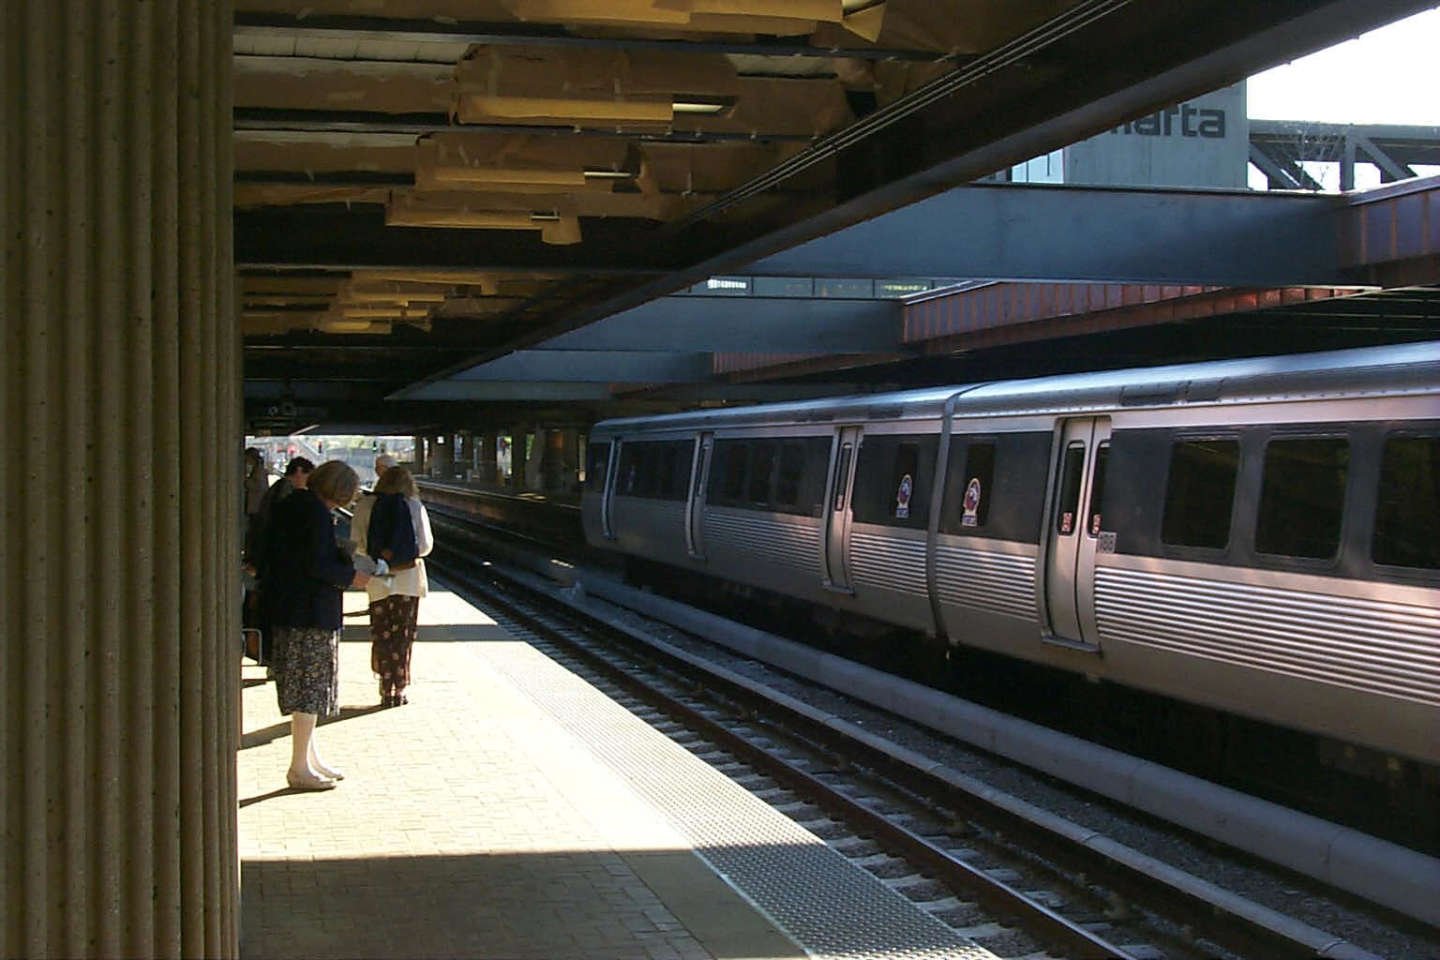
Avondale is on the Blue line. The station is located in a mostly commercial area. Residents living near Avondale spend less than the regional average on housing and transportation. In this area, the average resident drives 6,347 fewer miles annually than the regional average. Additionally, the average resident living near Avondale spends $281.48 more per year on housing than the regional average.
Median Household Income
income spent on housing :: 31%
income spent on transportation :: 21%
income remaining :: 48%
Census for 2012 :: 3,078
Projected for 2017 :: 3,170
Average travel time to work based on 60 minutes.
Employees earning more than $3,333 / mo.
Average apartment rental for this neighborhood station.
$911
$10,932
Equitable TOD combines people and place-based approaches to ensure that the value created when land near transit is built out is accessible to, and provides opportunities for, all community residents living near transit.
The market near Avondale station is strong and growing and has a low probability of changing demographics. Renters are the first to be affected by an increase in property values in a growing market.This area is near major job centers but lacks affordable housing.
In order to retain current residents and provide access to new amenities and services, Transformation Alliance?s equitable development strategy for this station area is:
Employed
Renters
WalkScore

| Station Area | Average from all Station Areas | ||
|---|---|---|---|
| MARTA Station Typology Designation | Neighborhood | ? | |
| MARTA Parking Utilization | 58% | 51% | |
| WalkScore | 74 | 69 | |
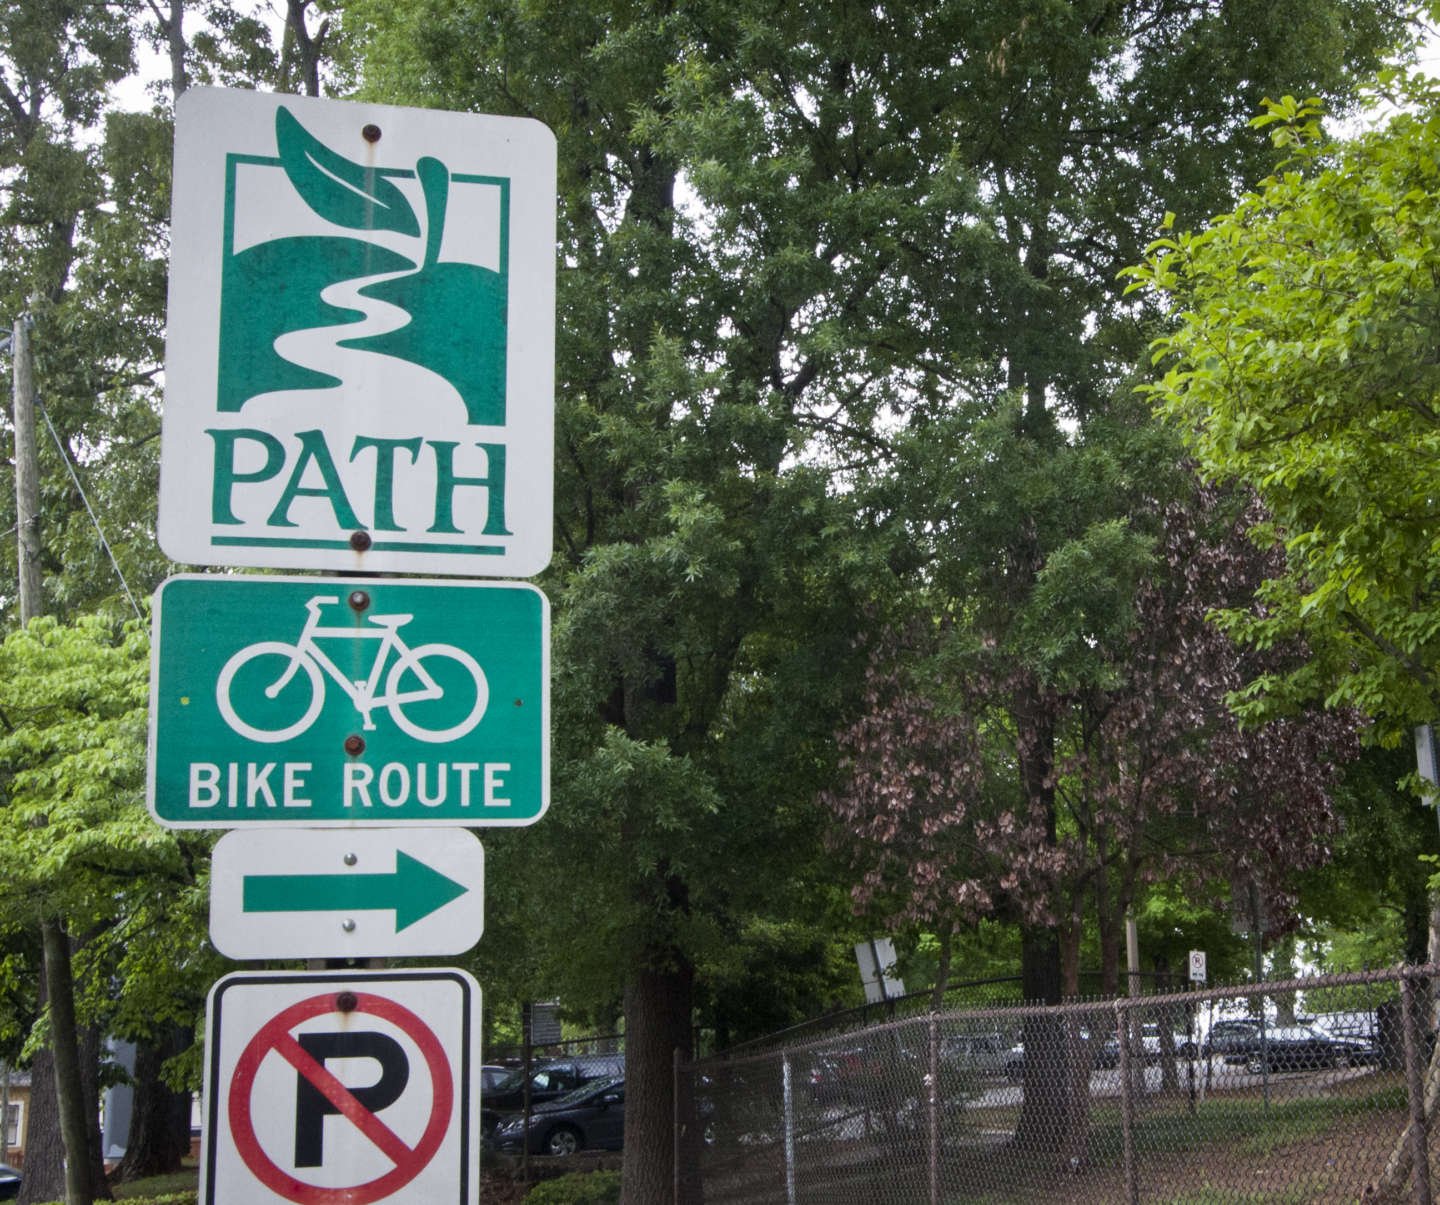
| Bike Score | 34 | ||
| Journey to MARTA Walk + Bike | N/A | ? | |
| Journey to MARTA Drive + Carpool | N/A | ? | |
| Journey to MARTA Transfer | N/A | ? | |
| Sidewalk conditions (miles) Above Average | N/A | 4 | |
| Sidewalk conditions (miles) Average | N/A | 5 | |
| Sidewalk conditions (miles) Poor | N/A | 4 | |
| MARTA Daily Enteries | 5,388 | 4,882 |
| Station Area | Average from all Station Areas | ||
|---|---|---|---|
| MARTA TOD Acreage | 7.2 | ? | |
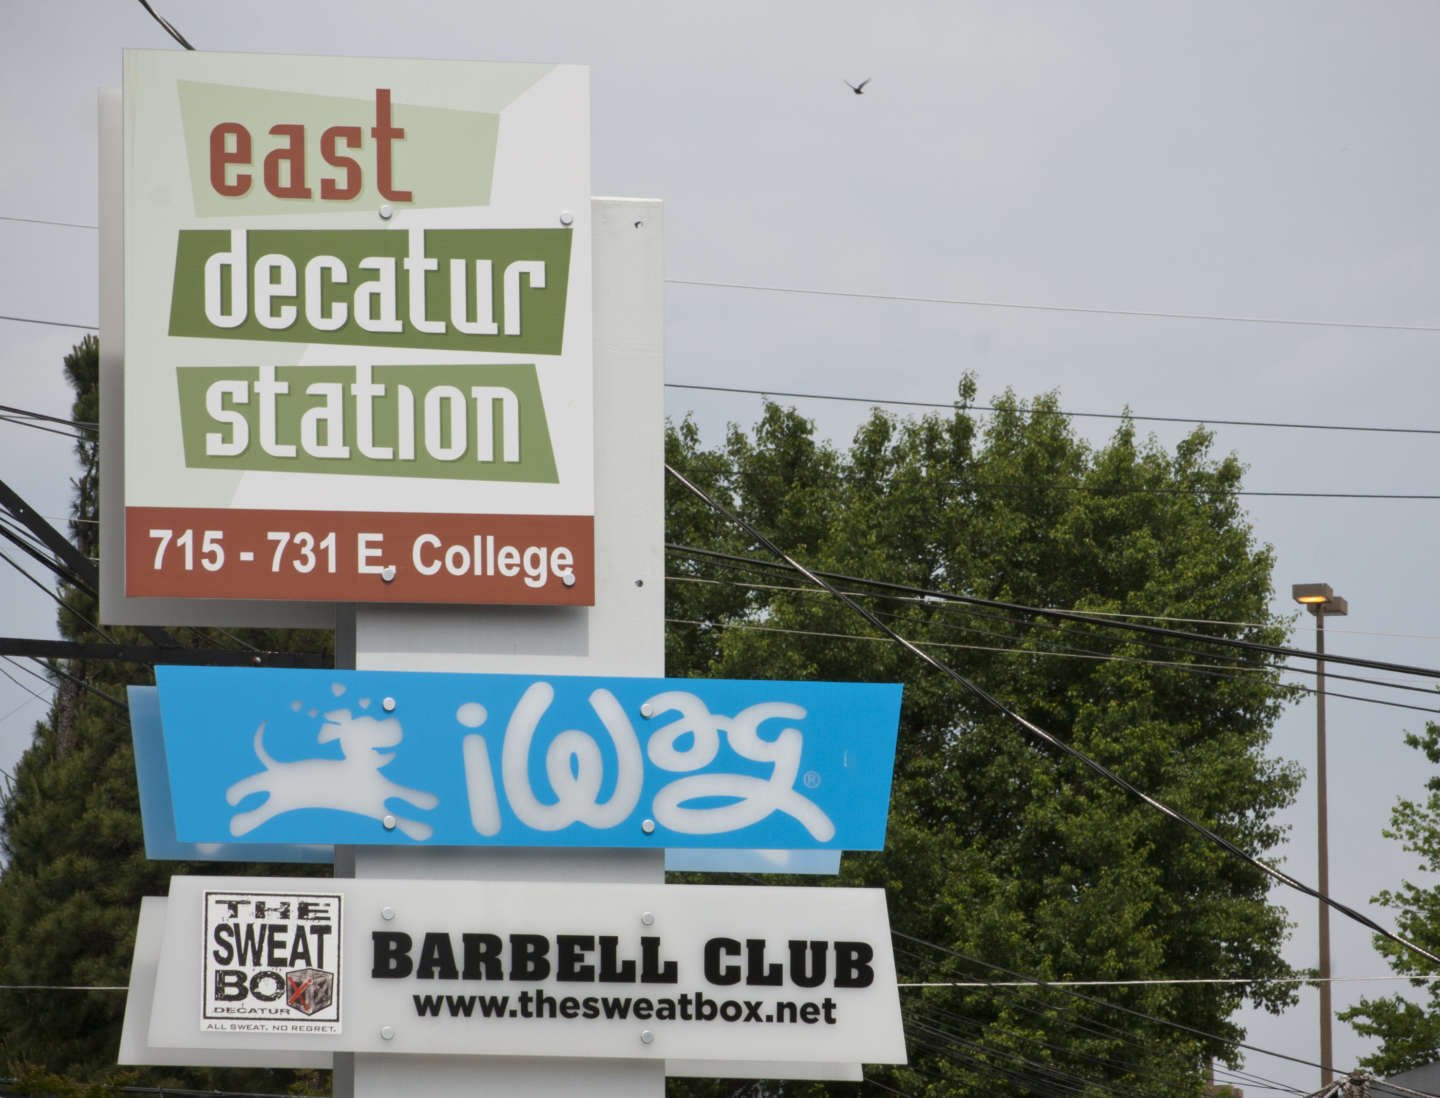
| Adjacent Large Properites | East Decatur Station | ? | |
| Zoning Station or Parking Lot(s) | I | ? | |
| Zoning Adjacent Area(s) | C-3, R-60 | ? | |
| Reccomended Intensity at the Site | 1.5-5 FAR | ? | |
| Current Intensity at the Site | N | ? | |
| TAD | No | ? | |
| TAD | Eligible | ? | |
| LCI | Avondale Station | ? |
| Station Area | Average from all Station Areas | ||
|---|---|---|---|
| Office - Inventory (SF) | 318,443 | 3,964,869 | |
| Office - Vacancy | 32.9% | 11.90% | |
| Office - Average Rent | $18.00 | $14.86 | |
| Office - 10 Year Growth | 1% | 3% |
| Station Area | Average from all Station Areas | ||
|---|---|---|---|
| Retail - Inventory (SF) | 214,609 | 1,474,105 | |
| Retail - Average Rent | $13.56 | $15.47 | |
| Retail - 10 Year Growth | -1% | 16% |
| Station Area | Average from all Station Areas | ||
|---|---|---|---|
| Housing - Inventory (Units) | 1,644 | 2,218 | |
| Housing Density / Acre | 3.3 | 4.4 | |
| Housing - % Renter | 36% | 56% | |
| Housing - % Multifamily 5+ Units | 30% | 53% | |
| Housing - % Built Since 2000 | 12% | 19% | |
| Housing - Average Apartment Rents (1 Mile) | $911 | $956 | |
| Housing - Average Apartment Vacancy Rate (1 Mile) | 4.1% | 7.30% | |
| Housing - 2012 New Avg. Sales Price (1 Mile) | $285,000 | $252,596 |
| Station Area | Average from all Station Areas | ||
|---|---|---|---|
| Population 2012 | 3,078 | 3,930 | |
| % Change 2000-2012 | 14% | 10% | |
| % Change 2012-2017 | 3% | 4% |
| Station Area | Average from all Station Areas | ||
|---|---|---|---|
| % Generation Y (18-34) | 20% | 35% | |
| % Singles | 51% | 75% | |
| Median Household Income | $63,542 | $44,720 | |
| % Employed | 63% | 62% | |
| % Use Public Transit | 9% | 17% |
| Station Area | Average from all Station Areas | ||
|---|---|---|---|
| Travel Time to Work (minutes) | 28.3 | 27.9 | |
| Number of Employees | 1,172 | 17,075 | |
| Employment Density / Acre | 2.3 | 34.0 | |
| % Employees Earning More than $3,333 per month | 28% | 54% | |
| Jobs to Housing Ratio | 0.7 | 7.1 |
Join our mailing list to receive the latest news and updates from our team.