10 Year LCI Update, Decatur
2010
This current study serves as the ten-year update for the Downtown Decatur LCI study and the five-year update for the Avondale LCI study, but also for...
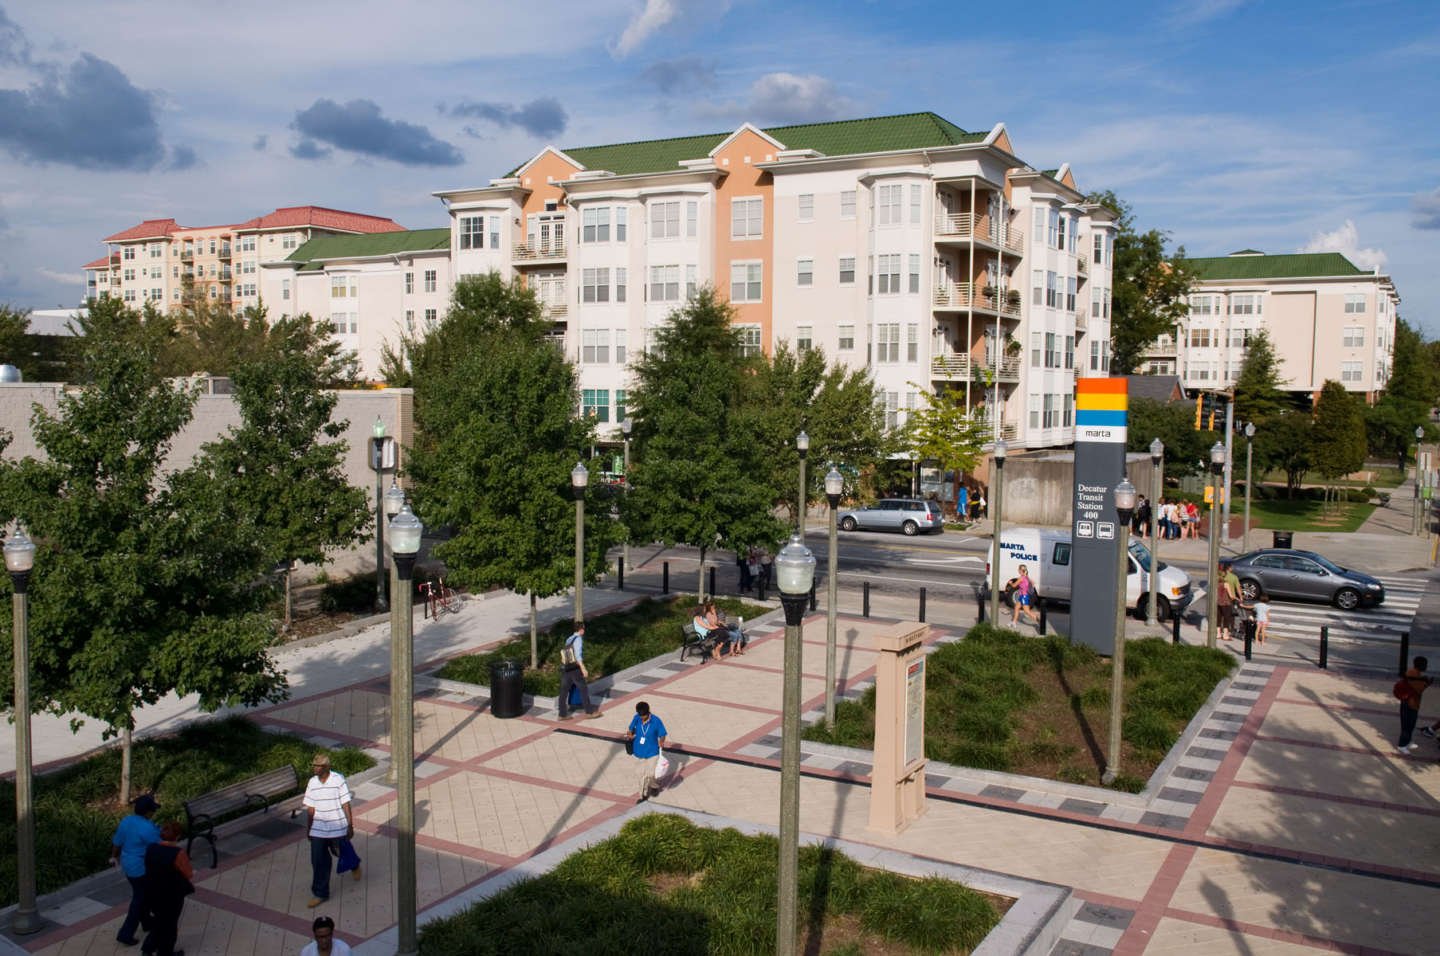
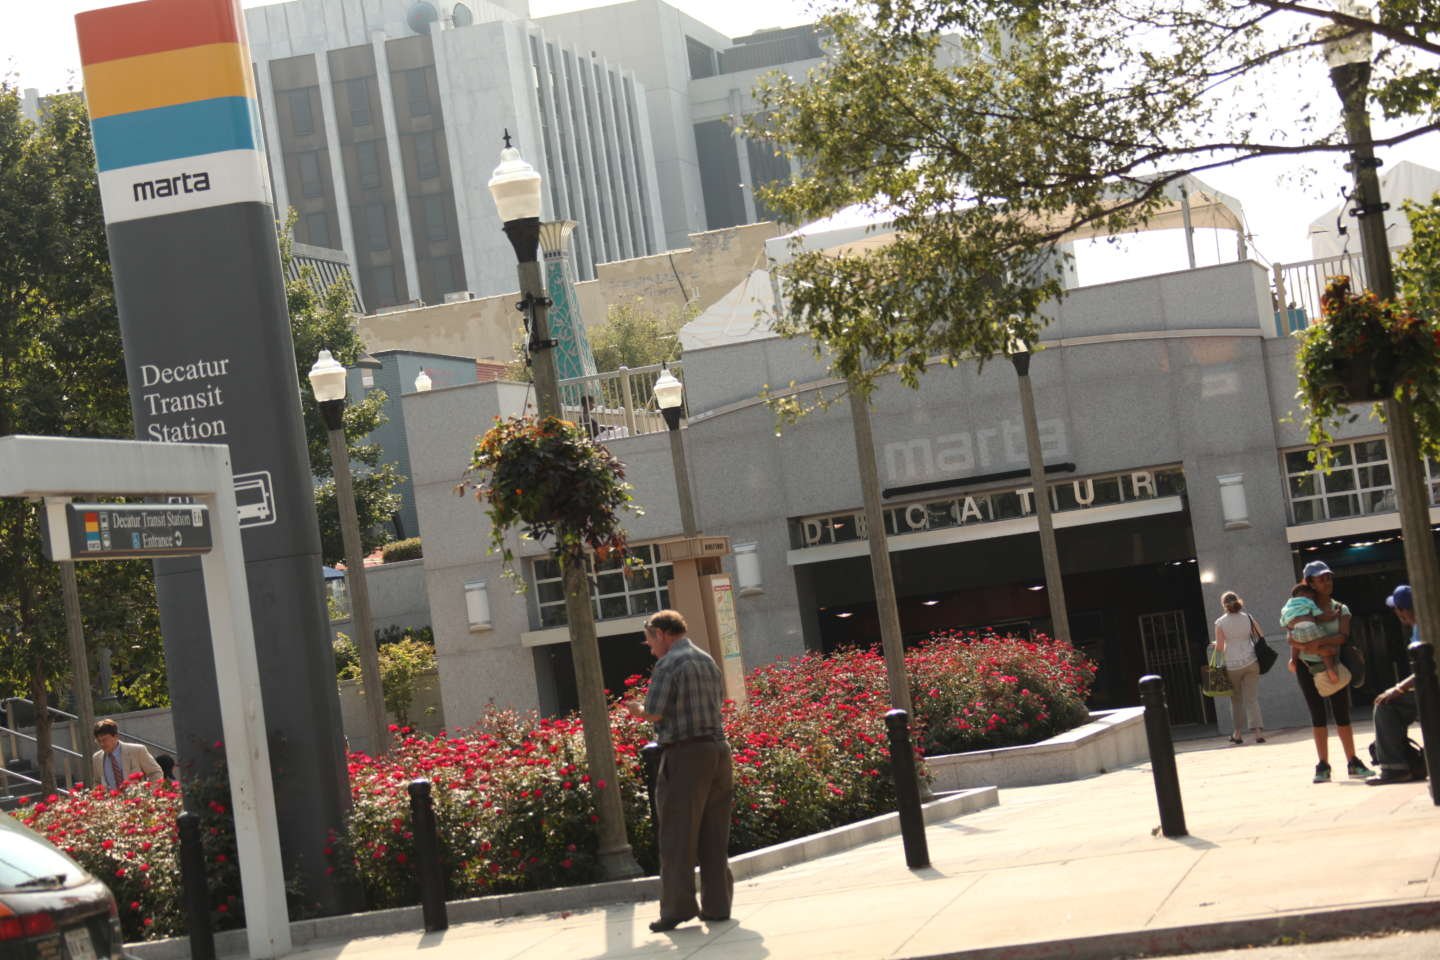
Decatur is on the Blue line. The station is located in a mostly industrial area. Residents living near Decatur spend less than the regional average on housing and transportation. In this area, the average resident drives 5,353 fewer miles annually than the regional average. Additionally, the average resident living near Decatur spends $3,265.29 more per year on housing than the regional average.
Median Household Income
income spent on housing :: 35%
income spent on transportation :: 18%
income remaining :: 47%
Census for 2012 :: 4,603
Projected for 2017 :: 4,787
Average travel time to work based on 60 minutes.
Employees earning more than $3,333 / mo.
Average apartment rental for this neighborhood station.
$817
$9,804
Equitable TOD combines people and place-based approaches to ensure that the value created when land near transit is built out is accessible to, and provides opportunities for, all community residents living near transit.
The market near Decatur station is growing and has a moderate probability of changing demographics. Renters are the first to be affected by an increase in property values in a growing market. As the market grows housing values will increase, limiting income diversity.
In order to retain current residents and provide access to new amenities and services, Transformation Alliance?s equitable development strategy for this station area is:
Employed
Renters
WalkScore


| Station Area | Average from all Station Areas | ||
|---|---|---|---|
| MARTA Station Typology Designation | Town Center | ? | |
| MARTA Parking Utilization | 0% | 51% | |
| WalkScore | 89 | 69 | |
| Bike Score | 34 | ||
| Journey to MARTA Walk + Bike | N/A | ? | |
| Journey to MARTA Drive + Carpool | N/A | ? | |
| Journey to MARTA Transfer | N/A | ? | |
| Sidewalk conditions (miles) Above Average | N/A | 4 | |
| Sidewalk conditions (miles) Average | N/A | 5 | |
| Sidewalk conditions (miles) Poor | N/A | 4 | |
| MARTA Daily Enteries | 4,466 | 4,882 |
| Station Area | Average from all Station Areas | ||
|---|---|---|---|
| MARTA TOD Acreage | 0.0 | ? | |
| Adjacent Large Properites | None | ? | |
| Zoning Station or Parking Lot(s) | C-2, I | ? | |
| Zoning Adjacent Area(s) | R-60, R-HDSF | ? | |
| Reccomended Intensity at the Site | 3-10 FAR | ? | |
| Current Intensity at the Site | Yes | ? | |
| TAD | No | ? | |
| TAD | Eligible | ? | |
| LCI | Decatur | ? |
| Station Area | Average from all Station Areas | ||
|---|---|---|---|
| Office - Inventory (SF) | 1,725,923 | 3,964,869 | |
| Office - Vacancy | 9.7% | 11.90% | |
| Office - Average Rent | $24.71 | $14.86 | |
| Office - 10 Year Growth | -1% | 3% |
| Station Area | Average from all Station Areas | ||
|---|---|---|---|
| Retail - Inventory (SF) | 111,7857 | 1,474,105 | |
| Retail - Average Rent | $16.81 | $15.47 | |
| Retail - 10 Year Growth | 27% | 16% |
| Station Area | Average from all Station Areas | ||
|---|---|---|---|
| Housing - Inventory (Units) | 2,437 | 2,218 | |
| Housing Density / Acre | 4.8 | 4.4 | |
| Housing - % Renter | 49% | 56% | |
| Housing - % Multifamily 5+ Units | 48% | 53% | |
| Housing - % Built Since 2000 | 19% | 19% | |
| Housing - Average Apartment Rents (1 Mile) | $817 | $956 | |
| Housing - Average Apartment Vacancy Rate (1 Mile) | 1.2% | 7.30% | |
| Housing - 2012 New Avg. Sales Price (1 Mile) | $336,050 | $252,596 |
| Station Area | Average from all Station Areas | ||
|---|---|---|---|
| Population 2012 | 4,603 | 3,930 | |
| % Change 2000-2012 | 14% | 10% | |
| % Change 2012-2017 | 4% | 4% |
| Station Area | Average from all Station Areas | ||
|---|---|---|---|
| % Generation Y (18-34) | 24% | 35% | |
| % Singles | 67% | 75% | |
| Median Household Income | $36,391 | $44,720 | |
| % Employed | 57% | 62% | |
| % Use Public Transit | 8% | 17% |
| Station Area | Average from all Station Areas | ||
|---|---|---|---|
| Travel Time to Work (minutes) | 26.4 | 27.9 | |
| Number of Employees | 13,153 | 17,075 | |
| Employment Density / Acre | 26.2 | 34.0 | |
| % Employees Earning More than $3,333 per month | 39% | 54% | |
| Jobs to Housing Ratio | 5.4 | 7.1 |
Join our mailing list to receive the latest news and updates from our team.